🗜 Reducing Rails Memory Usage by ~15%
We recently deployed a change to our Puma configuration that led to a ~15% reduction in memory usage across all of our Ruby on Rails applications! In this post, I want to go over what that change was as well as a bit of a dive into why it worked.

Memory usage on one of our application
If you are already familiar with Puma and the differences between running in single vs cluster mode then the TL;DR of this post is that we used to run puma in cluster mode with a single worker and have now changed that to running in single mode, simple as that 😄
So why does running puma in cluster mode use more memory? Before answering that question, here is a brief overview of how Puma does work.
How Puma does work
Puma uses a thread pool to do work, it is implemented in Puma::ThreadPool
which is the context within which our application code is actually executed.
However, puma doesn’t just pass incoming requests directly to this thread pool. Before passing a request to the thread-pool for work puma buffers the requests in a queue. There is a nice overview of how and why this is done in the Puma Architecture document.
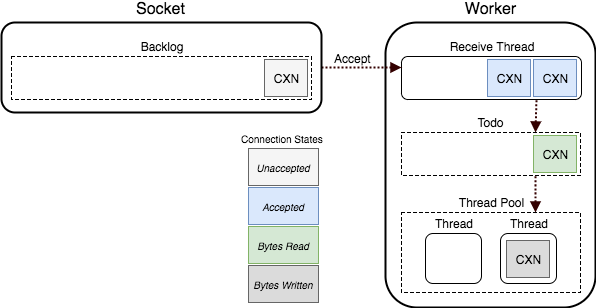
The Puma Connection Flow
The main gist of it is that there are 3 queues on which requests can be placed before being processed by our application:
- The Socket Backlog queue which holds an OS level-queue of network connections on the socket that the puma process is listening (outside of puma)
- The Receive queue which accepts connections from the sockets and buffers requests until they have been fully read (this prevents issues such as “slow-client” DDoS attacks) before pushing them into the “todo” queue
- The “todo” queue is the queue which the actual thread-pool mentioned above consumes from, it will pop off requests from the queue, call our underlying application, and write a response.
As an aside, the time which a request waits in the “todo” queue is the metric we use in order to trigger auto-scaling of our web dynos. This is the amount of time which a request which was fully ready to be processed had to wait before being processed, if it trends upwards it means we aren’t spreading the load across enough instances and so we (automatically) provision more!
Cluster Mode vs Single Mode
Puma has a concept of (and by default runs in) “cluster-mode” whereby a number of separate ruby processes can listen to a socket and process requests as described above. Running puma in cluster mode has an overhead of running n+1 processes, where n is the number of workers you would like to run. This is because puma needs to run an additional process to manage the pool of workers. This is called the “Runner”.
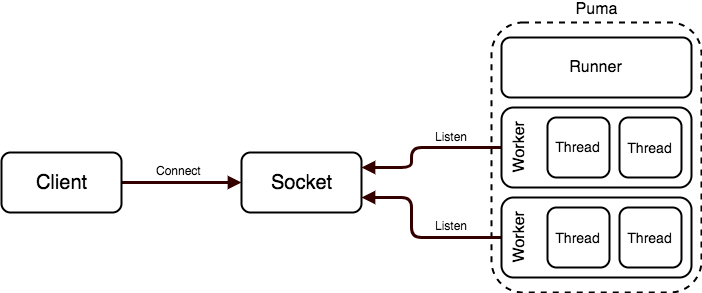
Puma’s General Architecture
The “Runner” is responsible for managing the “Workers”, it starts, restarts, and stops them. Workers are created by “forking”. Forking is a way by which a currently running process can create a new “child” process. When a process is forked its memory is copied to the new process and it continues execution from the same place. For example:
#!/usr/bin/env ruby

puts "I am process ##{Process.pid}"
pid = fork

if pid
  puts "I am the parent ##{Process.pid}. My child is ##{pid}"
else
  puts "I am the child  ##{Process.pid}"
end

# Output:
# => I am process #50601
# => I am the parent #50601. My child is #50749
# => I am the child  #50749
This is how Puma works and why we use things such as preload_app!,
before_fork and on_worker_boot in our Puma configuration to manage how this
behaves.
preload_app! is especially interesting as it exists in order to make use of
an optimisation that OSes can provide when forking processes called
“Copy-on-Write” or CoW.
CoW delays the allocation of memory to the child process until the memory being used has been written to and becomes “dirty”. This allows multiple processes to use the same memory until it is required that they have their own memory. By “preloading” the application, the runner process loads up our rails app and allocates all the required boot-up memory (including running our initializers) before forking that memory onto the worker. This reduces boot-up time on the worker processes and should also reduce overall memory footprint.
In single-mode puma bypasses all of this and only runs a single worker process
that has no “runner” orchestrating it. It does not preload_app! or have
before_fork and on_worker_boot hooks, because they are not necessary.
Because our configuration only runs a single worker in cluster mode we create additional unnecessary memory allocations. By simply turning this off we save a pretty handsome amount of memory!
Results
You can see a reduction in usage after boot and then over time as well from around ~12–1 PM in the following graphs.
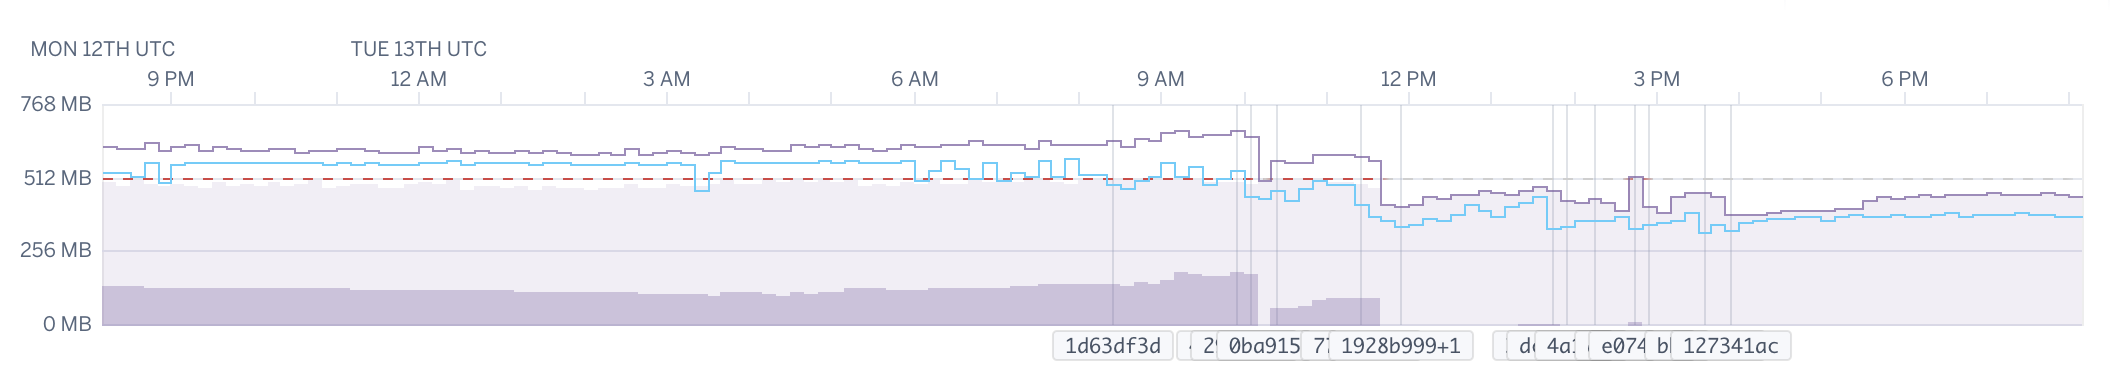
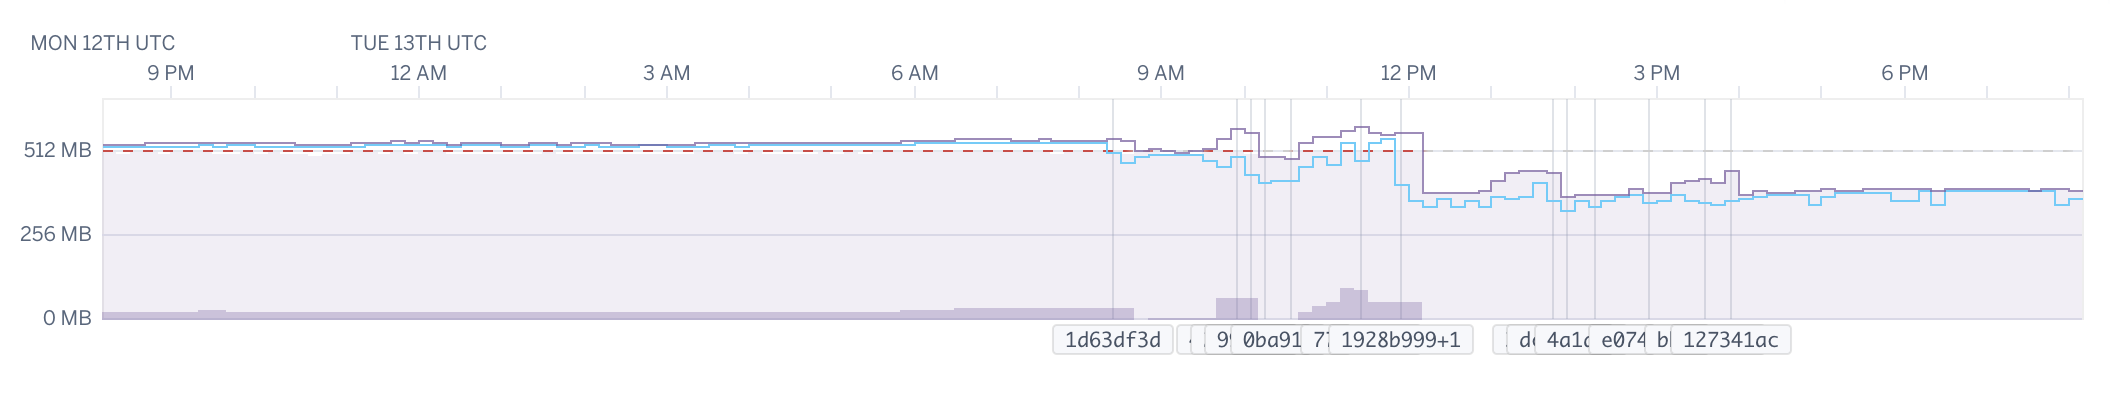
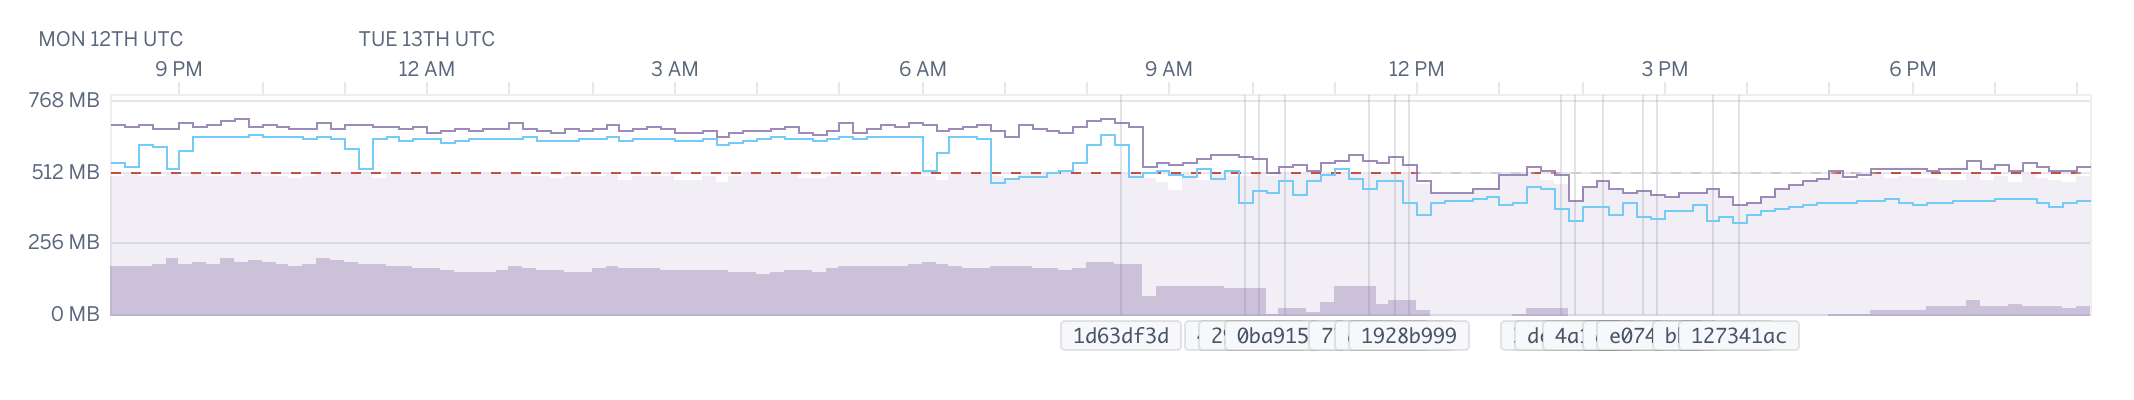
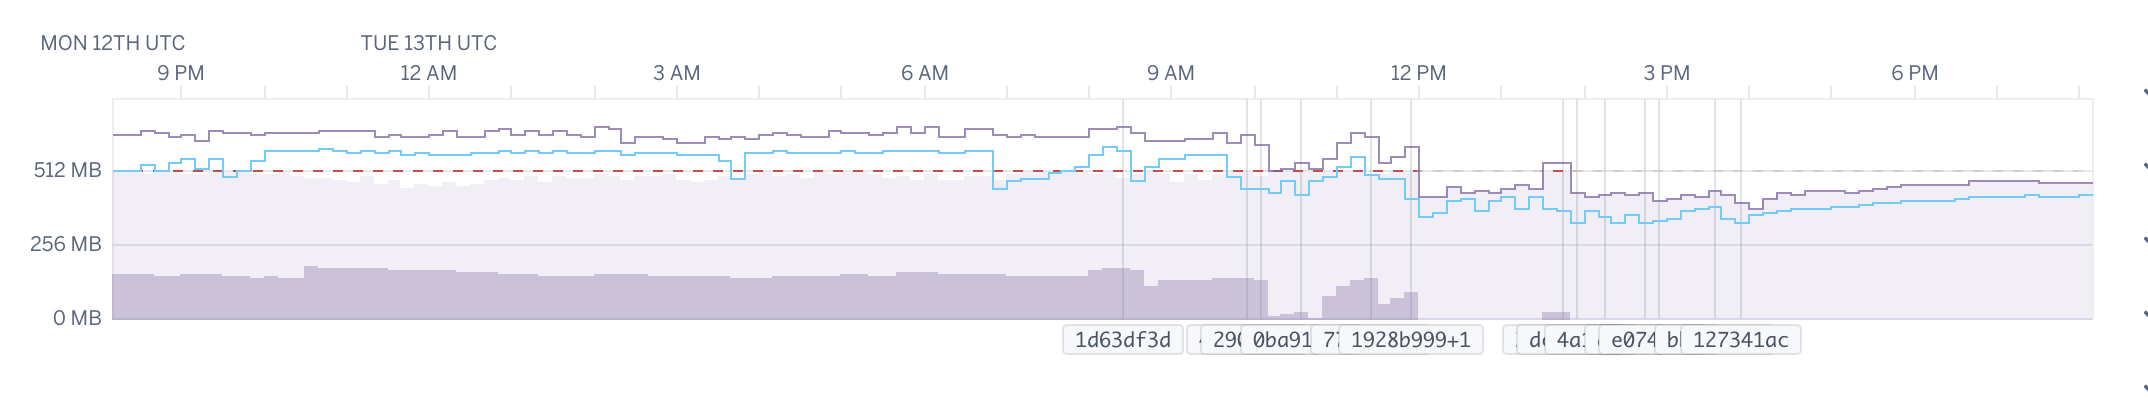
The good thing about this reduction is that it brings our dynos under the 100% (512MB) limit that Heroku has on our Standard-1X dynos.
While this is a ‘soft’ limit in that Heroku won’t kill our process if we exceed it (it will only kill a process that is using over 200% its expected memory) it does result in the usage of “swap” memory. In the graphs above you can see the use of “swap” in dark-purple. The use of swap occurs as soon as we exceed the 512MB limit.
“swapped” memory are chunks of memory that a process holds that are removed from RAM and dumped onto disk by the OS when there is not enough memory available in RAM. This can cause significant performance impact when the process tries to access memory that has been swapped to disk as it requires the OS to dump some other memory into swap and load the requested memory from disk again. This is orders of magnitude slower than having that memory in RAM (as people who studies this lovely memory hierarchy diagram below will already know):
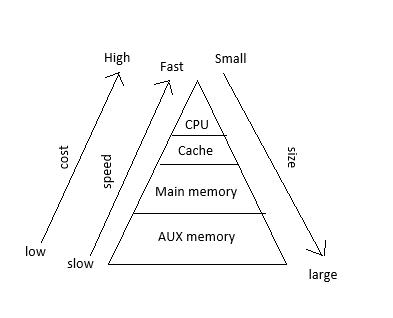
Memory Hierarchy, Cost and Speed are inversely proportional to the size/capacity
Summary
Hopefully, this was a pretty decent intro into how puma works in general and the differences between cluster and single-mode. As well as touching a little bit on OS processes, forking, and memory hierarchy, which are all pretty interesting topics which can fill a full semester worth of learning. 😄
I stumbled across this idea to try out changing our configuration after reading puma/puma#2393 which describes how some people saw puma double in memory usage after upgrading to 5.0.0 which was caused by an (inadvertent) change in puma which led to properly respecting the WEB_CONCURRENCY environment variable and running multiple workers.
This isn’t the first decent performance improvement that I’ve found by fixing/changing really old configuration, it’s always worth investigating and experimenting with options that are set in your production configuration and initializers, things might have changed significantly since you first wrote or generated that configuration, especially if the project was started many major versions ago.