📈 Scaling Ruby on Rails on Heroku with Connection Pooling
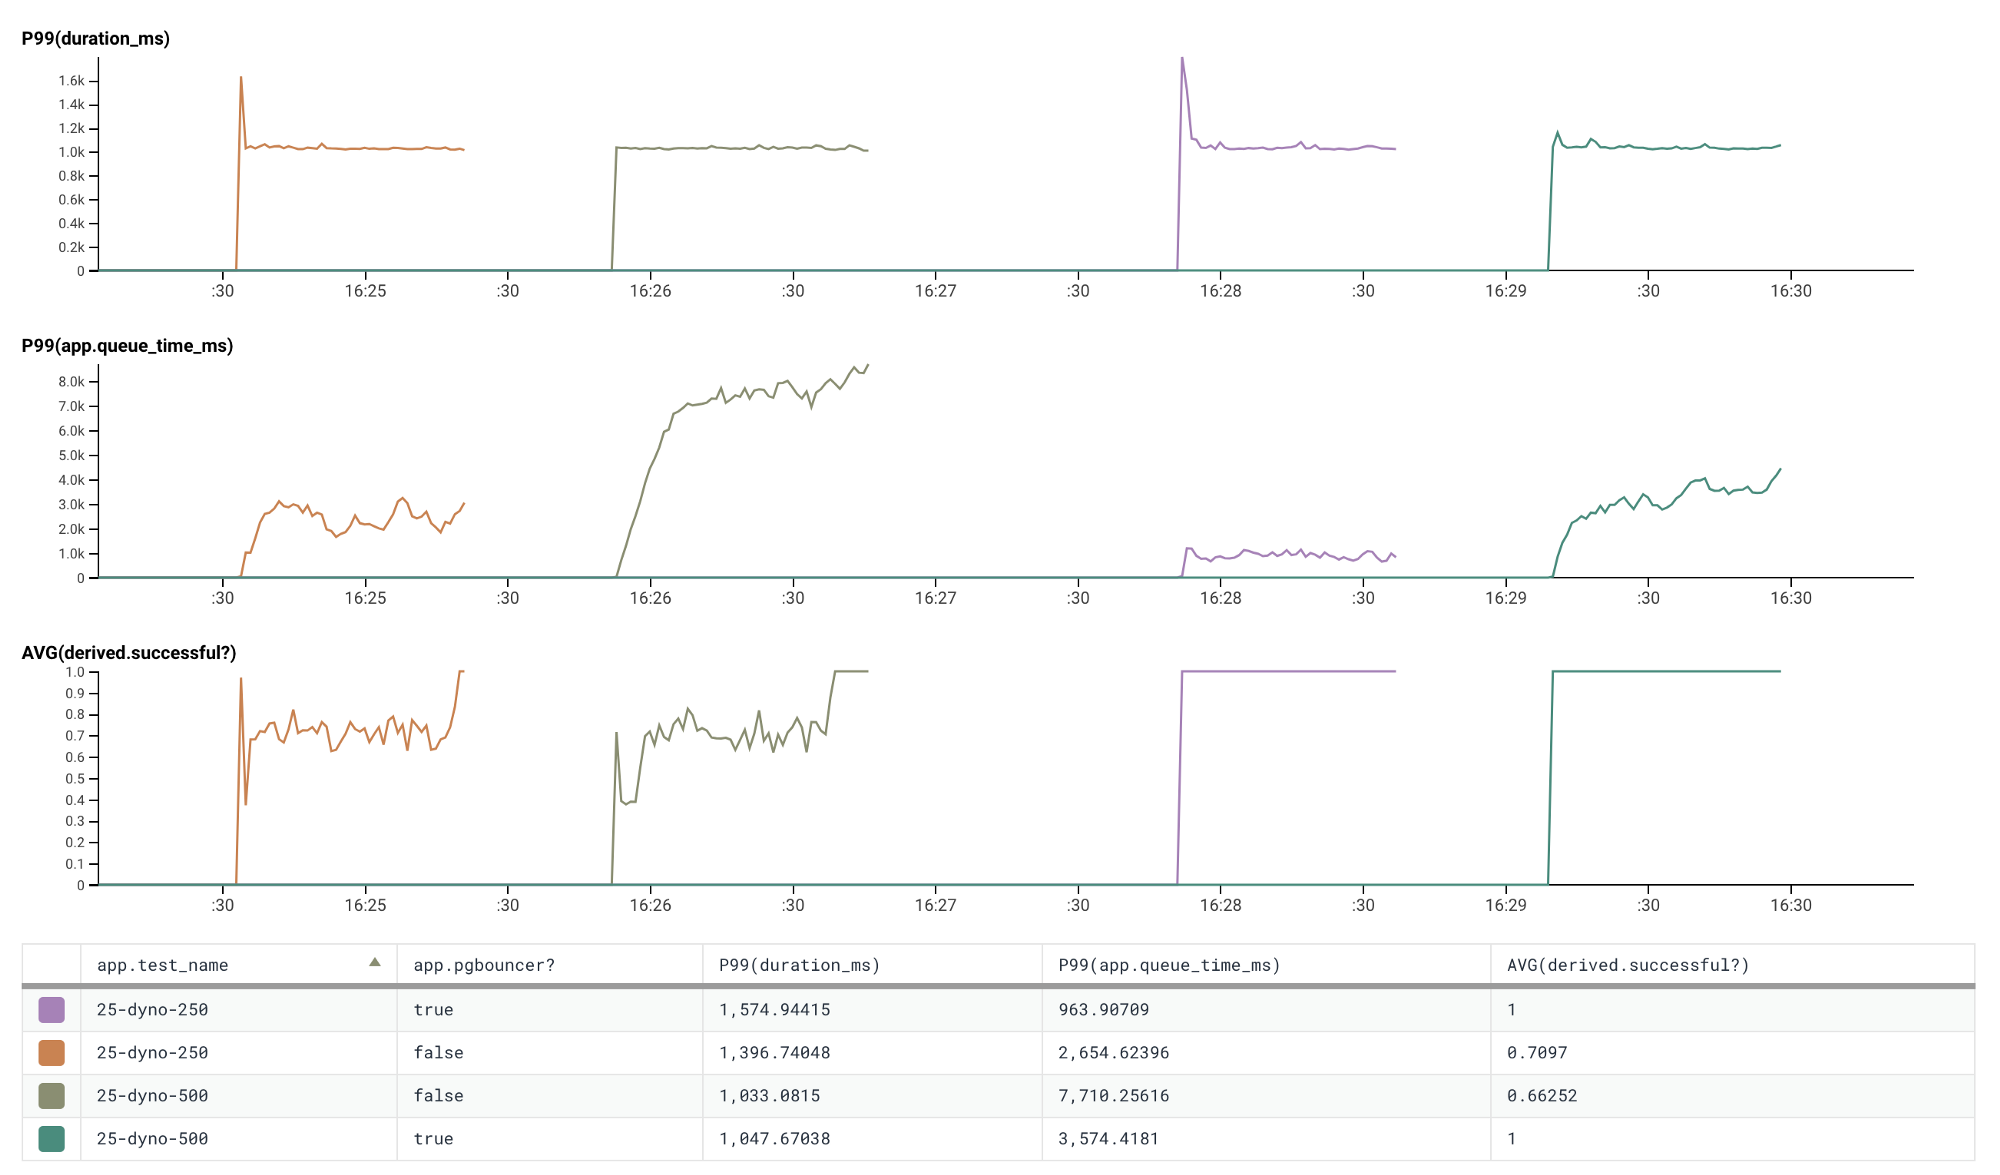
The result of one trial in the experiment I ran to test out Connection Pooling, depicting P99 duration and queue times as well as average request success rate.
Heroku recently made Connection Pooling for Heroku Postgres databases generally available. This is exciting! I decided to take a weekend to see how this might affect our ability to scale our Ruby on Rails applications at carwow.
In this post I want to go over the evolution of scaling an application from one dyno to many as your application gains traction. We’ll cover different resource constraints that you might encounter, some ways which we’ve overcome them, and finally how Connection Pooling could help us to increase our application capacity by ~4x.
I created a dummy application and ran a series of trials against that application with a varying number of dynos, concurrent requests, and either using or not using connection pooling.
Each trial ran for 45s, the application always did a 500ms pg_sleep on a
standard-0 Heroku Postgres instance and 500ms sleep on the ruby side. This
simulates a 50/50 split of DB IO and other IO work which is fairly
representative of the workloads we see at carwow.

Table showing P99/90/75/50 percent of time which a request is waiting on the database vs total request runtime across three production Ruby on Rails application (results over a 14-day time period).
Throughout this post I will be referencing this application and metrics pulled from the experiments run on this application to step through the simulated increases in traffic over time.
One of the key metrics to know about is “request queue time” which is what we use to to autoscale our dyno formations.
Request Queue Time is the amount of time between a request being ingested by Heroku’s routing layer (as timestamped by the X-Request-Start header) and the request arriving at our applications middleware. This indicates the amount of time which a request was fully ready to be processed but was waiting on resources on your application to be free. A persistently high/increasing value in this metric signals that your application is under-provisioned for the current level of traffic.
A high or persistent increase in the value of this metric is an indication that our application is under-provisioned and is not able to keep up with the amount of traffic being directed to it. If this metric continues to grow it can lead to cascading performance degradation or failure as downstream applications fail to access data and Heroku drops requests as they exceed the 30s timeout mark.
Cool, let’s get going! 🚀
Starting with a single dyno
Let’s start at the very beginning with a single dyno running a single process and 10 threads. The ActiveRecord connection pool is also set to 10. What happens if we start to send more than 10 concurrent requests to the application?
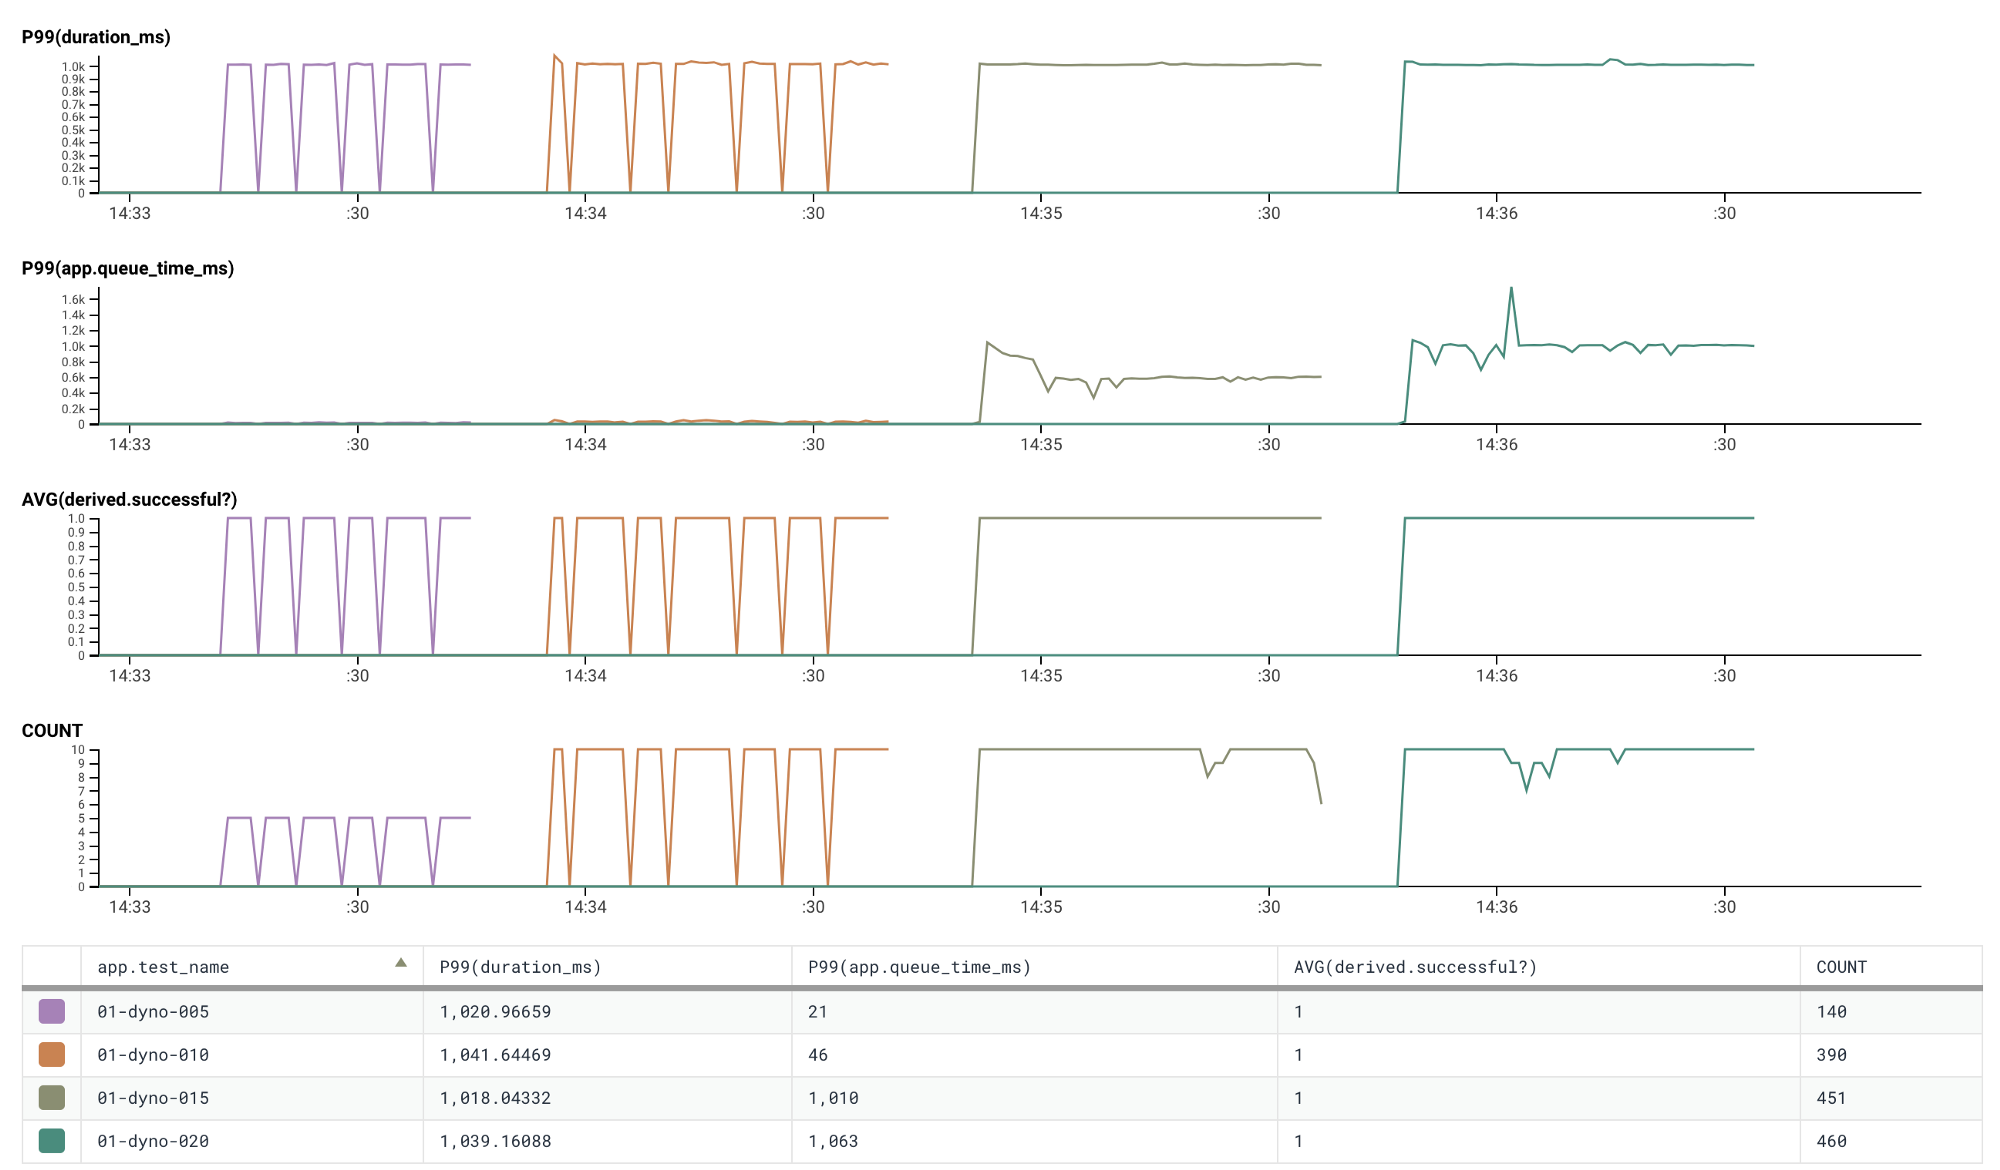
Showing an application running one dyno with a constant flow of 5/10/15/20 concurrent requests being made to it
The app.test_name column is formatted as NN-dyno-MMM. NN is the number of
dynos currently running on the application (in this case 1), MMM is the
configured number of concurrent requests (in this case, 5, 10, 15, 20). The
tool that creates load (hey) will continually
make up to MMM concurrent requests, whenever one request completes it will
start a new one.
We can see that as the number of concurrent requests exceeds the number of threads configured on the application the request queue starts to increase. This is to be expected. We only have 10 threads available to process work so we can only process a maximum of 10 requests at a time. Any additional request will need to be queued and wait until a thread is free in order to be processed.
There are a number of ways to improve this situation, we can either try to make every request faster or we can scale our application to have more threads available.
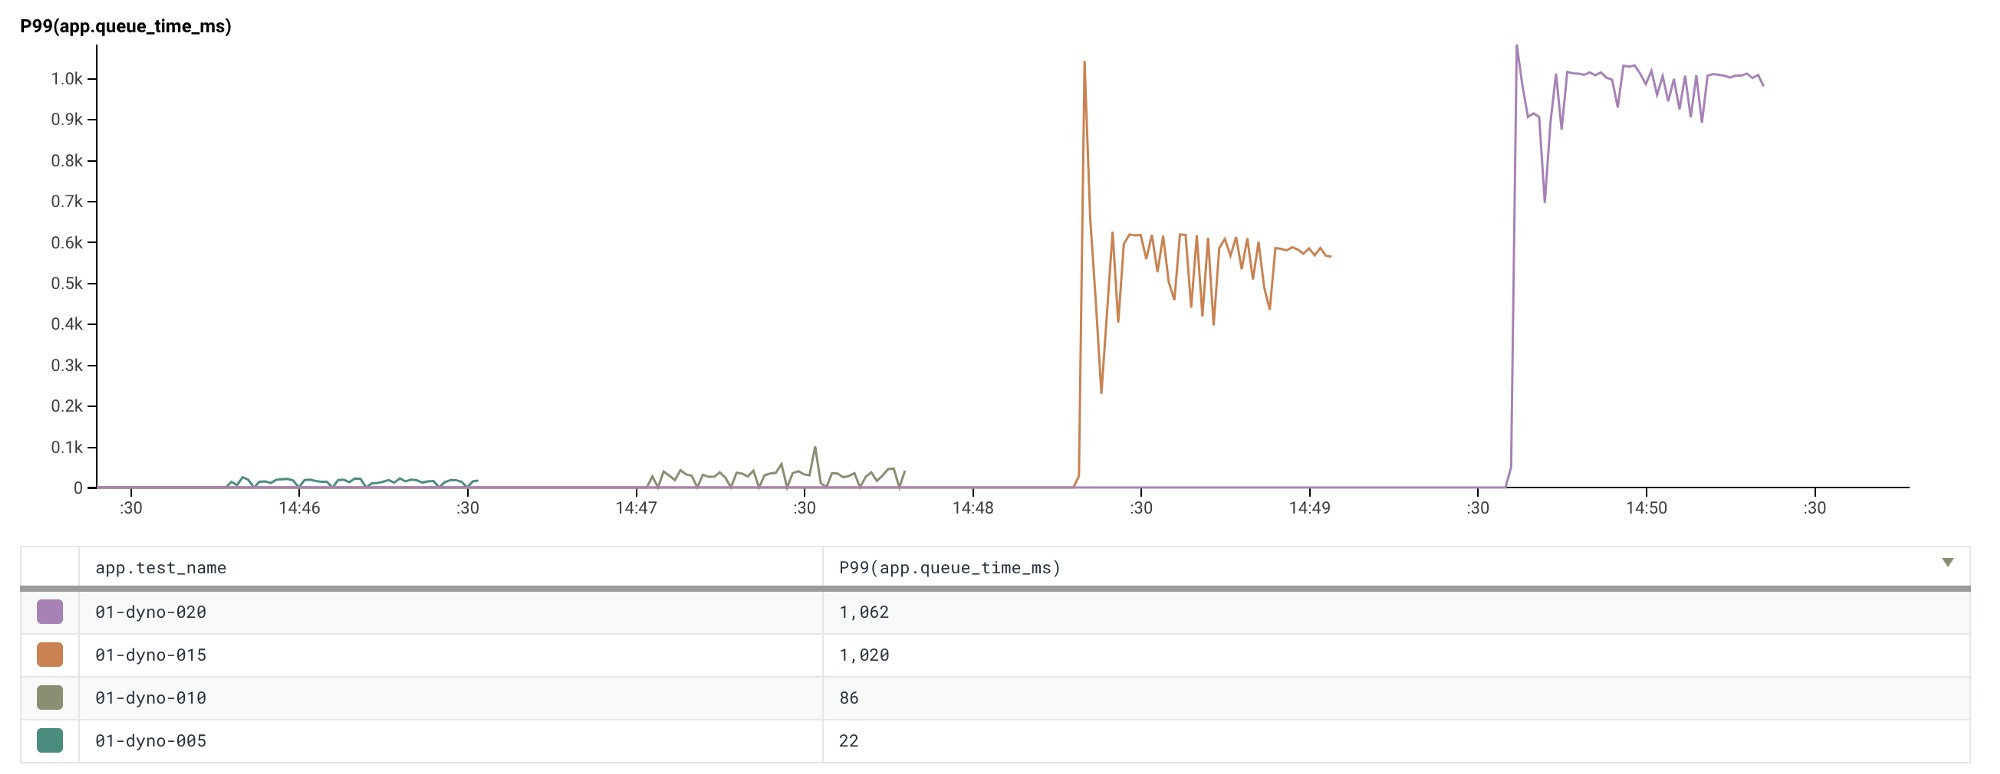
Focusing in on request queue time, showing an increase as the number of concurrent requests exceeds the number of threads available
For the sake of this blog post we’ll assume that the application is already fully optimised1. This leaves us only with the option to increase the amount of threads available. We can do this by increasing the number of puma workers, the number of threads, or both! I think for the majority of applications the main things restricting the number of threads and processes will be available RAM.
The more threads and processes running, the more RAM you will need available. There is a great blog post on memory usage over time by Richard Schneeman (schneems) which is well worth a read.
At a high number of threads per process you might also have to start worrying about CPU contention as MRI/CRuby is restricted to running on a single CPU core due to the Global VM Lock (GVL).2
Let’s assume that we’ve maxed out the RAM available on our dyno and we either already have or don’t want to scale vertically anymore (scaling vertically = provisioning larger dynos sizes to get access to more resources).
In this scenario, our only path forward is to scale horizontally, spinning up more dynos to increase the total number of concurrent requests our application can handle. At work we do this automatically (we ‘auto-scale’) using HireFire based on the request queue metric across all our dynos.
Scaling horizontally to multiple dynos
So autoscaling has kicked in and we are now running 5 dynos, traffic has increased as well now steadily with 30, 40, 50, and 75 concurrent requests.
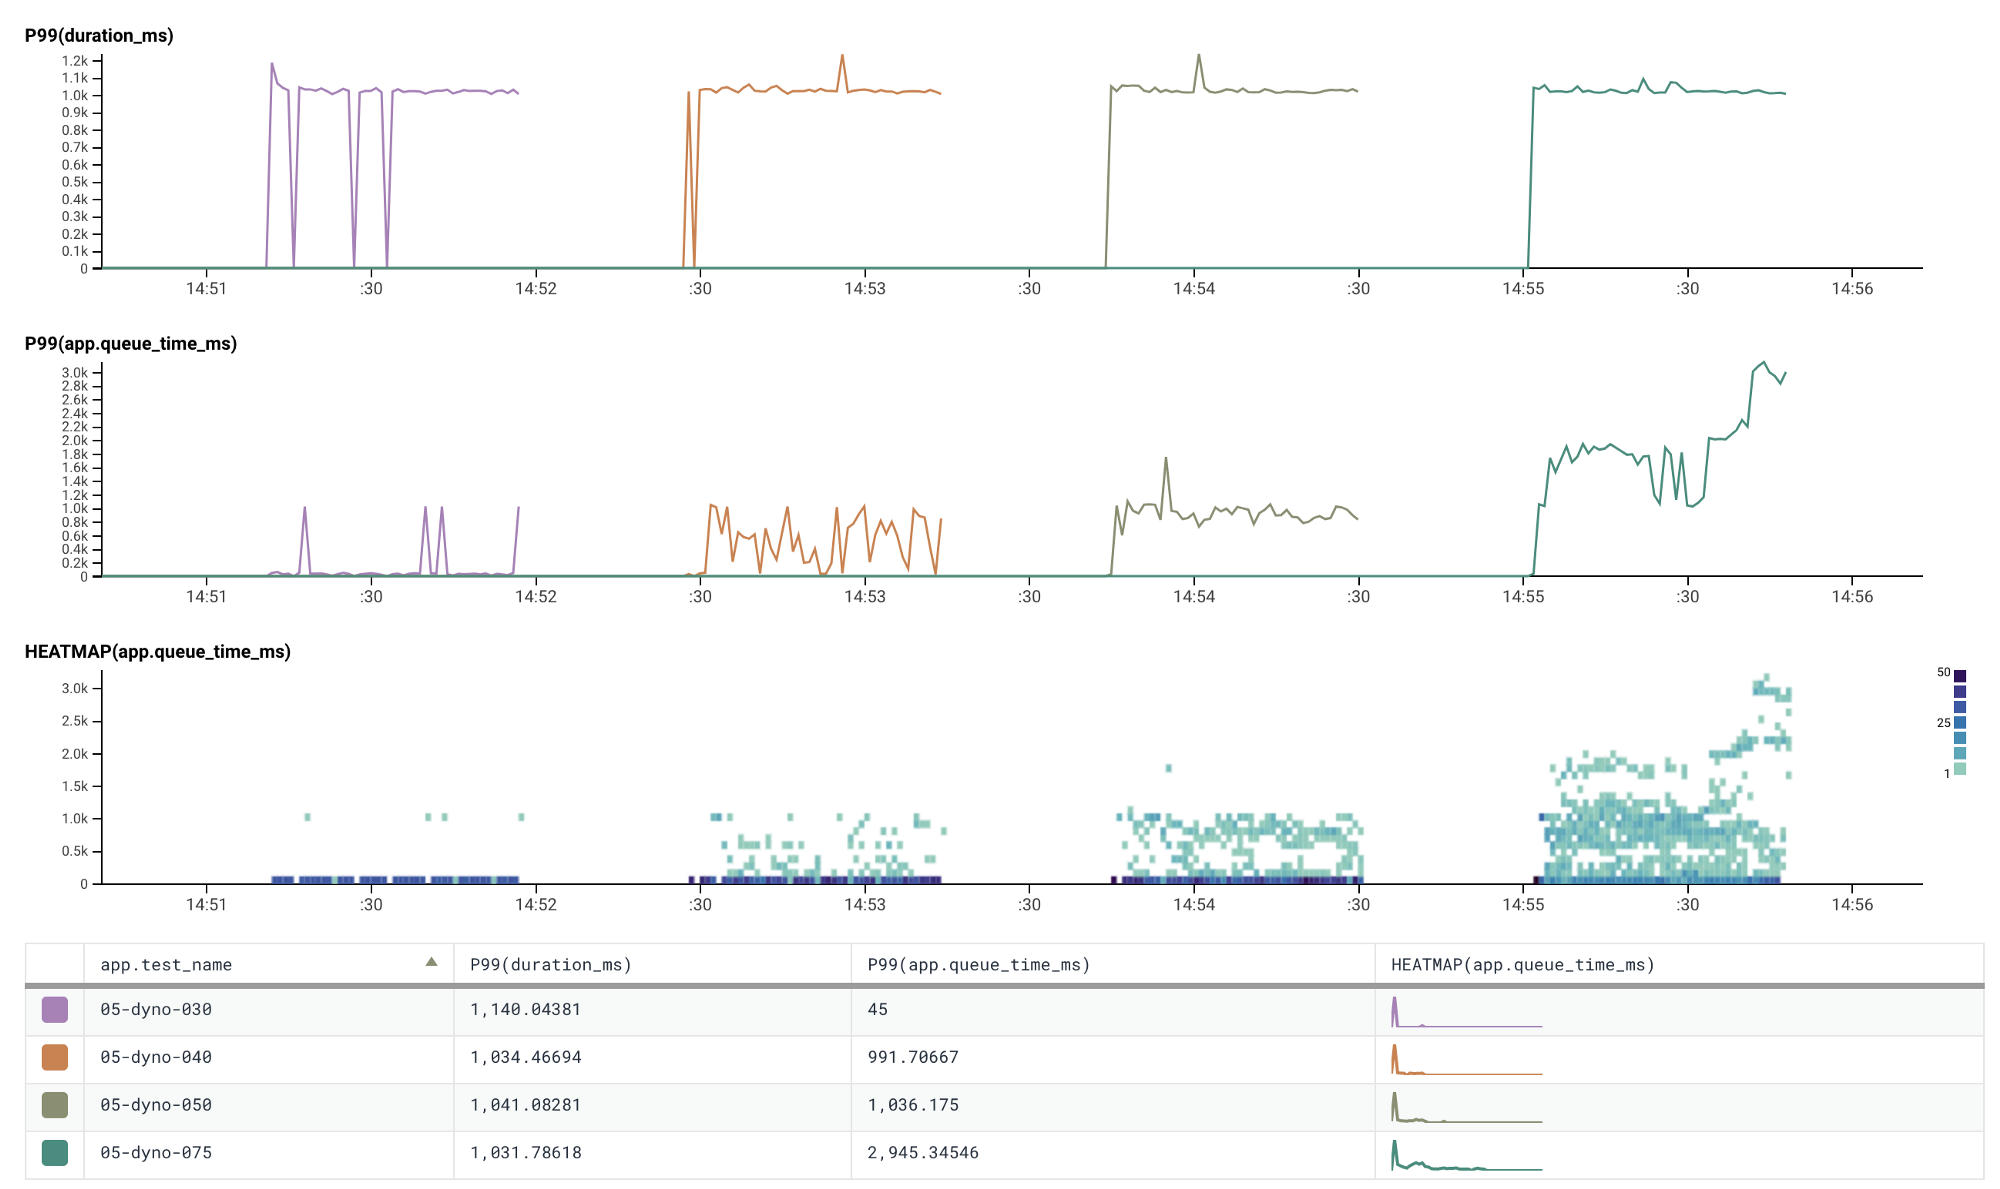
Scaling our application to five dynos with 30/40/50/75 concurrent requests
There are some spikes in queue time on the levels of traffic that we wouldn’t expect3, but they are not persistent so it isn’t much of an issue. The reason for these spikes is because Heroku routes requests randomly across the whole dyno formation. This means that it is entirely possible that over a smaller timeframe the distribution is not uniform causing one or two dynos to be routed more requests than others, thus increasing the queue time on those dynos. If we look at the heatmap we can see this a little bit more obviously. Looking at the P99 doesn’t always give us the full picture!
That being said in general the same pattern observed with one dyno shows with five — queue time increases as the number of concurrent requests increases and exceeds to total number of web threads available. Albeit with a little bit more noise in the data.
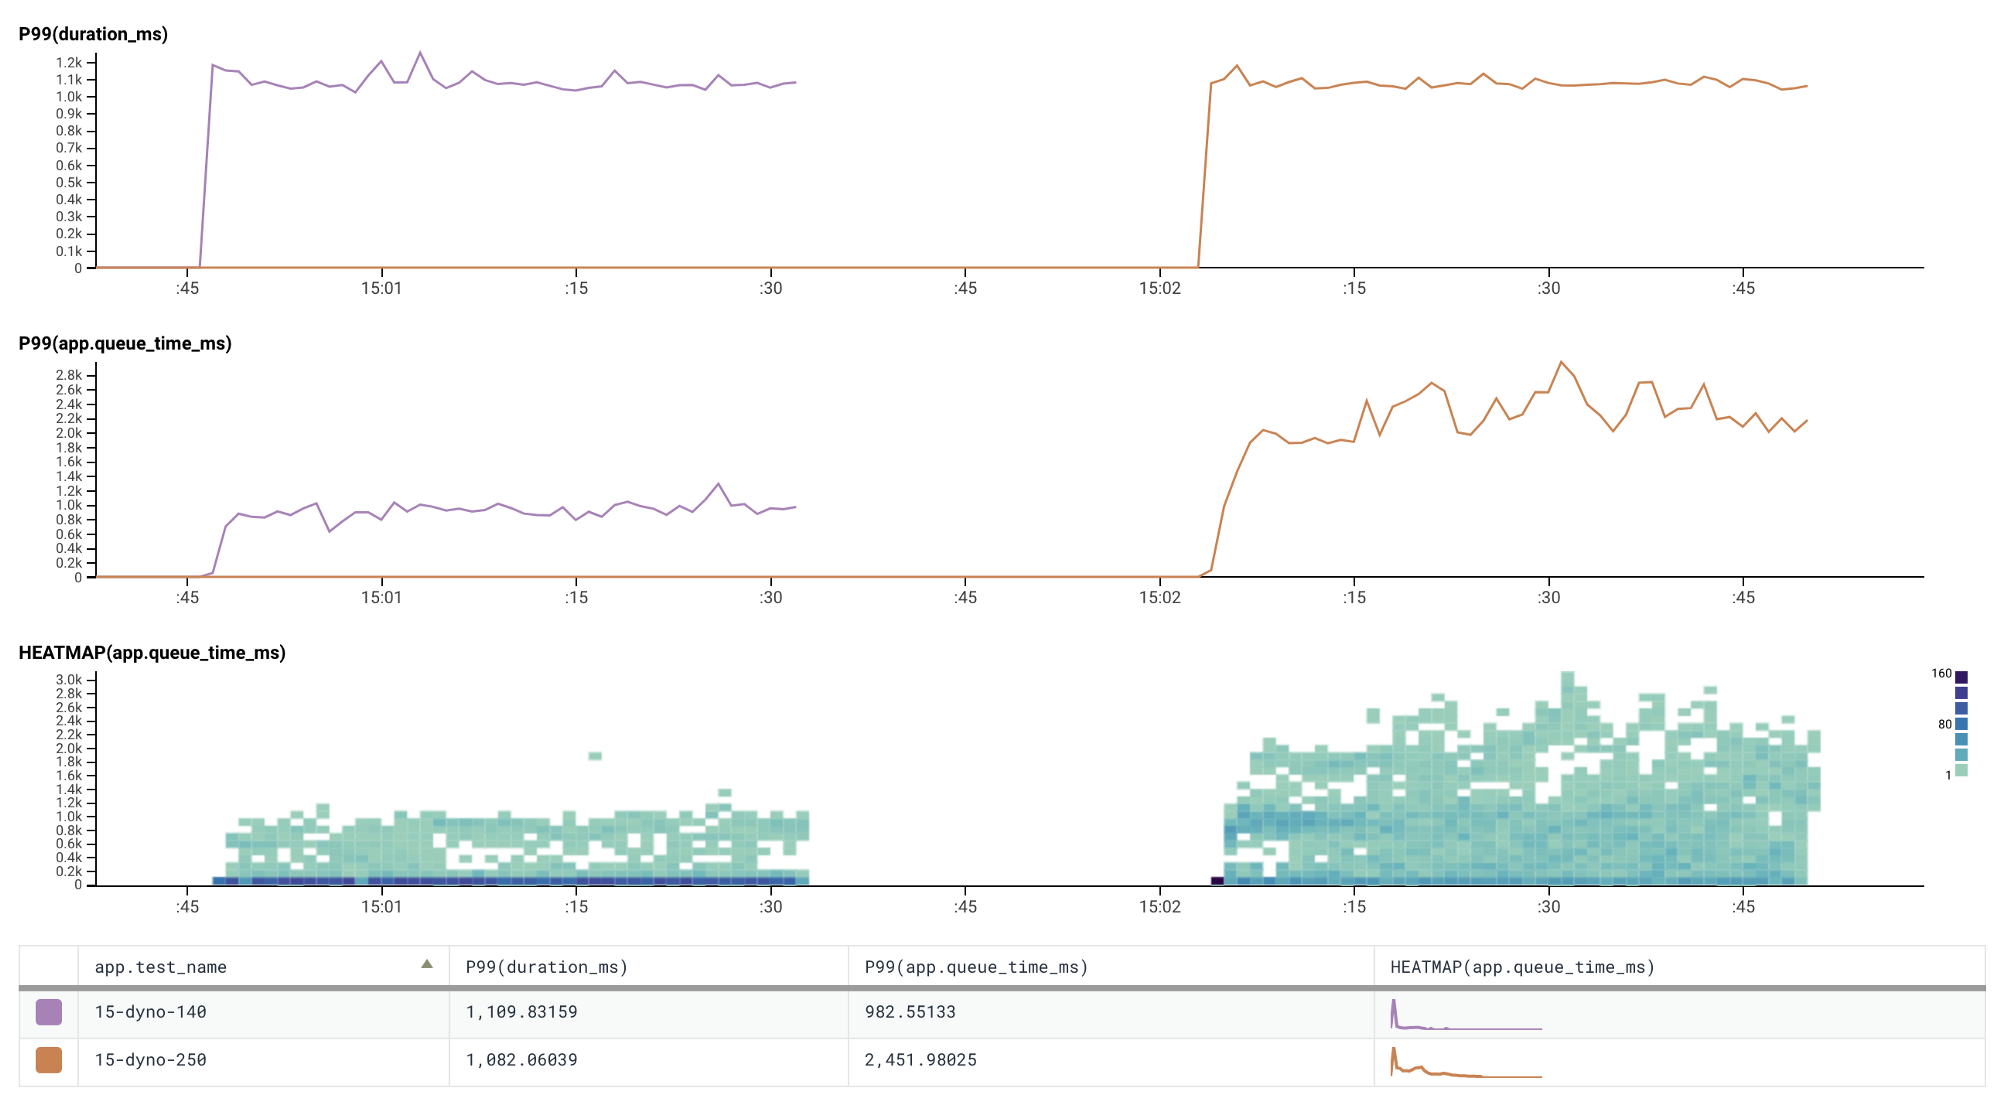
Scaling to fifteen dynos continues with the trend shown with one and five dynos
The limits of horizontal scaling
Horizontal scaling looks to be very promising, our scaling problems are solved! We can continue to provision more dynos whenever we notice request queuing increasing and persisting. This could be true if your application doesn’t make use of any external resources. However, in our case each dyno connects to the database and at some point we’ll start to exceed the provisioned resources on the database.
In the case of this application, the primary DB resource we are constrained by is the total number of available connections.
A standard-0 Heroku Postgres instance has a limit of 120 connection which can
be opened at any one time. Our application will open up to 10 connections per
dyno. In theory, this means that our application can only scale up to 12 dynos
before it exceeds this limit. In practice, it seems that the hard limit is
around double that (240 connections, 24 dynos).
What happens when we exceed this limit?
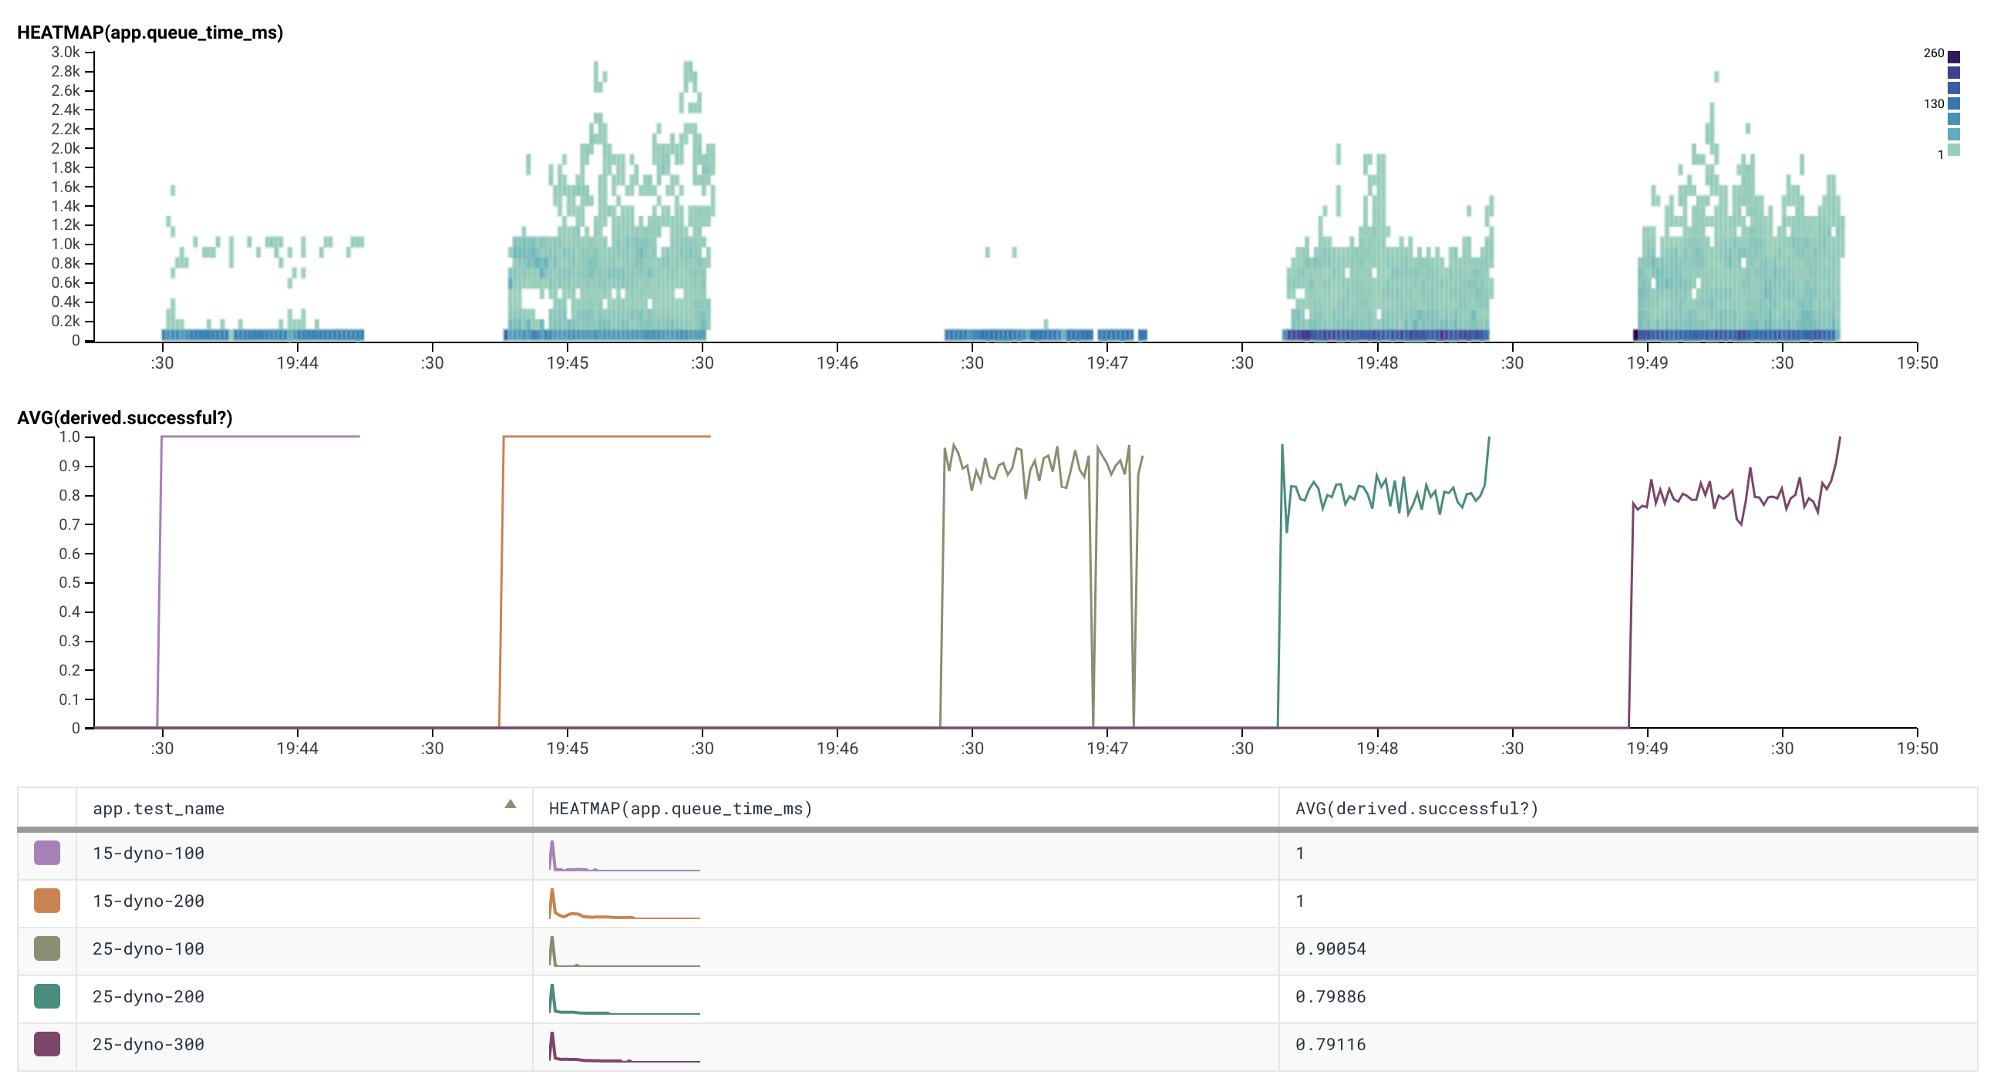
The graph above shows this scenario, as we increase our number of dynos and concurrent requests, the pattern established previously persists. What is new is that the average rate of successful HTTP responses has deteriorated as we’ve scaled our dyno formation in excess of the available database connections.
As we exceeded our connection limit the Rails application fails to connect to
our database. Raising a PG::ConnectionBad error with this message FATAL: remaining connection slots are reserved for non-replication superuser connections.
How do we get around this problem? We’ve already optimised the heck out of our app and on this database plan we can’t scale horizontally anymore without seriously affecting request success rate as we run out of connections.
We can increase our Heroku Postgres plan to get access to more connections. The
standard-2 (there is no standard-1) plan increases our available connections to
400 and standard-3 to 500. However, after 500 connections we can’t get anymore!
Let’s assume we’ve forked over the cash and delayed this issue. We’re running a
standard-3 database, we’re now able to run ~50 dynos4 and are hitting issues
with scaling. What do we do now?
Before connection pooling was available one solution to this issue, which we’ve gone with at carwow, is to create a read-only replica of our application5.
This approach works really well, we’ve been running it on two of our largest apps for over a year. It has a fairly high initial cost of set up, but once your CI/CD pipeline has been configured properly and you have it initially set up in Terraform, it isn’t too much of a burden to manage and replicate to new applications, especially if the alternative is to move all of our infrastructure off of Heroku. 😄
Using Connection Pooling to enable more horizontal scaling
Now that Connection Pooling is available there is a much less involved way to enable our application to scale more horizontally without causing large amounts of requests to fail!
The graphs below show comparisons of running our test application with 25, 50, and 75 dynos with and without Connection Pooling (pgbouncer) enabled.
Notice any differences? 😛
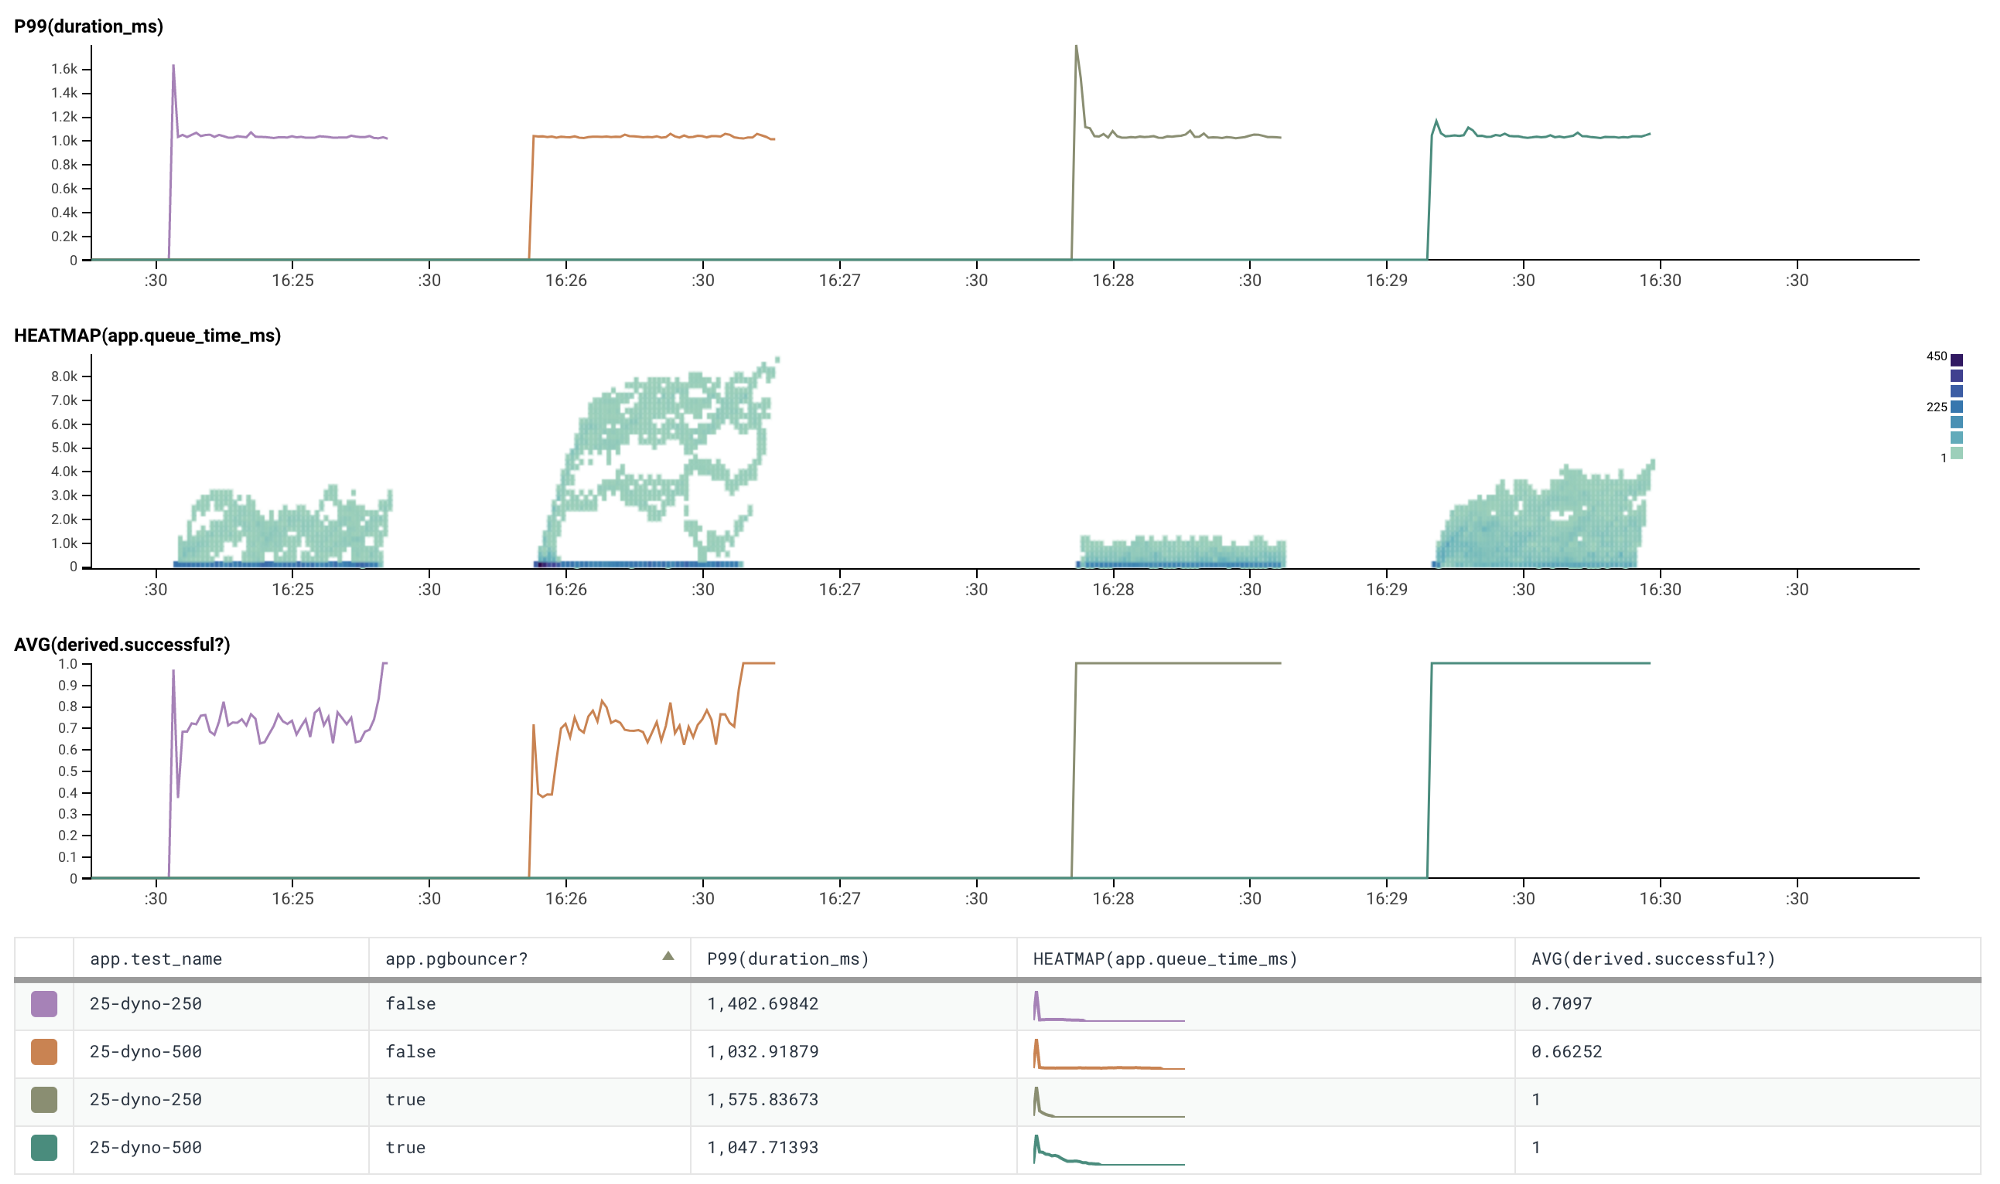
Running with twenty-five dynos two trials each with and without connection pooling (pgbouncer) enabled
We’re back up to a 100% success rate! Connection Pooling allows us to scale our application horizontally way past what we used to be able to. By adding a layer of indirection over the underlying ‘physical’ database connections and sharing them between all of the client connections we can increase the utilisation of the underlying connections and avoid total failure to acquire a connection.
At the beginning of this post I mentioned that each request spends 500ms sleeping on the database and 500ms sleeping in the Ruby thread, which was more-or-less representative of database usage seen on production applications at carwow.
Based on this, we can say that the database connection utilisation over the lifetime of a request in our test application is 0.5 or 50%. We’re holding on to the database connection for the lifetime of the request but only using it for 50% of that time, what a waste!6
Connection Pooling works at the database transaction level, each transaction can run on any one of the underlying connections, this means that over the lifetime of a web request you might use as many different connections as you have transactions. In between those queries you aren’t holding on to that physical connection, other clients and web threads are free to use it!
This allows us to make much better use of the underlying connections (increasing utilisation), allowing us to scale horizontally with minimal impact on overall request latency. We are able to allocate connections at a higher level of granularity, while also making it impossible to the exceed the total number of allocated connections and therefore the possibility of hard failure. We are trading system failure for (potential) performance degradation when connection utilisation exceeds 100%.
This works remarkably well on our test application as we increase to running 50 and 75 dynos.

Application running fifty dynos
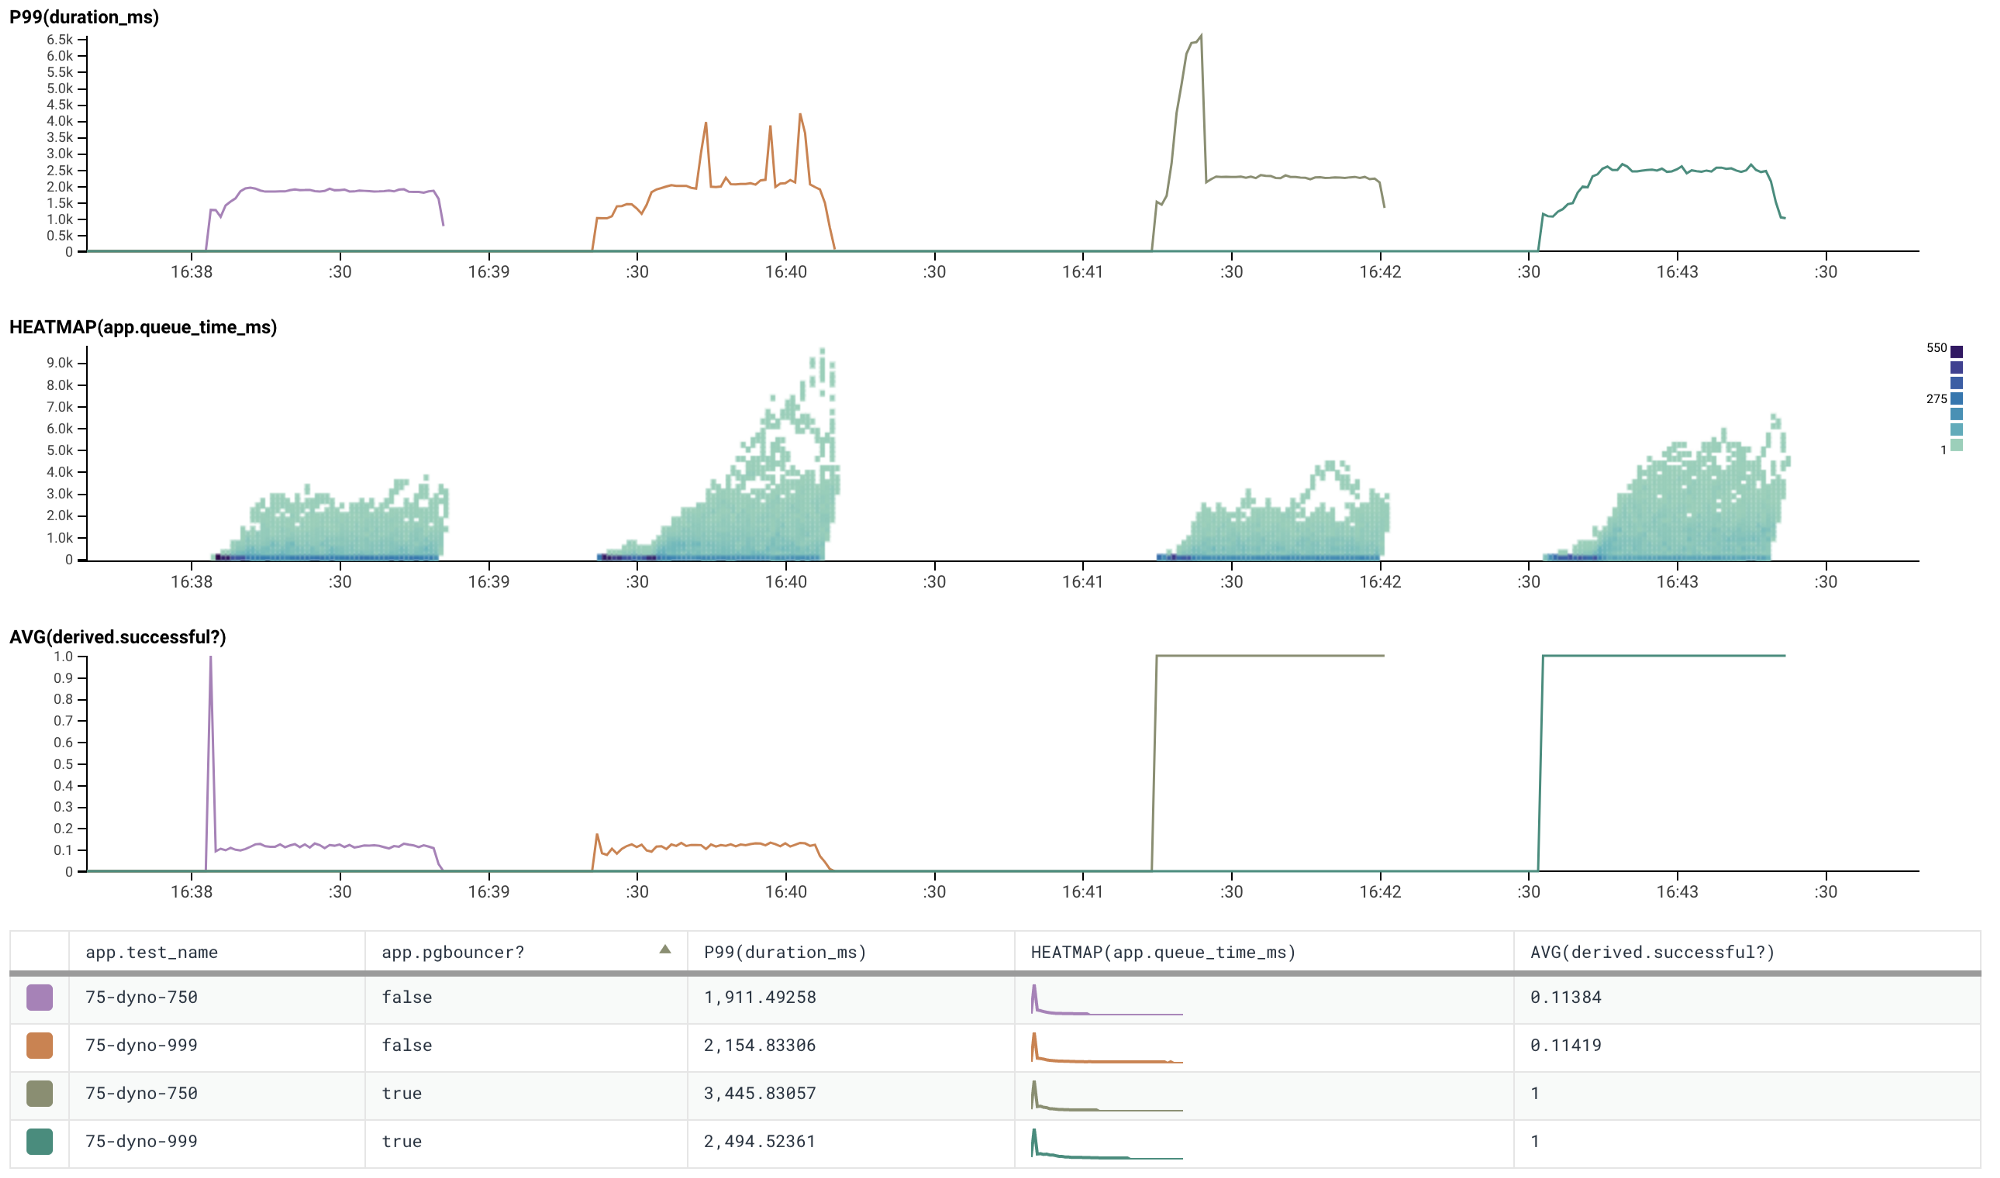
Application running seventy-five dynos
We’ve scaled an application running a standard-0 database with 10 connection
per dyno to 75 dynos and no pesky PG::ConnectionBad errors to be seen!
The cynics among you will probably be asking: what’s the catch?
And there is a catch or two with this. If you are eagle-eyed you will have
noticed in the later trials (running 50 and 75 dynos) the duration_ms metric
starts to creep up over 1s with a pretty significant spike actually in one of
the trials running 75 dynos. This is most likely explained due to contention on
the underlying database connections, as well as a potential overhead to using
the connection pool itself.
The connection pooler still only has 90 connections available to it (Heroku only makes 75% of the total allocated connection pool available to the pooler, pgbouncer). If all 90 of the underlying connections are used, any additional transaction will be queued until a connection becomes available, much like what happens with our web requests. As queueing increases so does overall latency. This could be an issue if it persists over time but is vastly better than complete failure! Make sure to set appropriate timeouts.
Some more caveats are that because connections are shared on a transaction basis, session variables will leak as there is no guarantee that a client will be assigned the same connection across transactions. This means you cannot make use of some PG features such as session variable and prepared statements. You should consult the pgbouncer documentation for more details.
Overall, however, very promising! With the increased utilisation of database connections and no longer needing to reserve connections for prebooting we’ve successfully increased the number of dynos we can scale by over 4x.
We should really have only been running ~6 dynos on this application in theory in order to stay well within connection limits and to have reserved enough connections to preboot properly.7
In the end we’ve managed to scale up to 75 dynos before seeing any significant performance impact on total request duration due to contention on the underlying database connections.
Final notes
We’re still working out the finer details of this feature and will be running a couple more tests to make sure that timeouts work as we expected them to before trying this out on a couple of production applications. I’ll update this post if with any additional learnings during that process.
In the meantime, I hope that this was informative and that you were able to take away some learnings for your, your teams, or your company’s journey to scaling your applications to handle more load. It’s a very nice problem to be having, but one that ideally you already have an idea how to solve!
Worth noting that it might be wise to look into other more common performance issues before exploring connection pooling as a solution! Fix your N+1 queries, investigate sensible places where caching could help (at all the different layers of your stack), reduce JSON blobs, use optimised collection rendering in Rails, and so on! ↩︎
In a previous version of this post this was tacked on to the end of this paragraph:
although I think in most cases Rails applications spend the large majority of their time on I/O rather than CPU, so it’s probably not something people in general need to worry too much about

This is highly dependent on the workloads of your application and may not be true for you, and after taking the time to look at the data from applications in production at carwow, it seems it wasn’t true for those applications either. Which showed a ~50/50 balance between CPU work and IO.
You should be able to measure the general split of IO vs CPU on your application by subscribing to the
process_action.action_controllerActiveSupport::Notificationand measuring the proportion ofcpu_timevstotal_time. This should give you a good indication of the split of work being done on your application if enough samples are collected. If you want more accurate measure you might need to roll your own middleware and measure the difference betweencpu_timeandtotal_timeyourself.cpu_timecan be found as the difference ofProcess.clock_gettime(Process::THREAD_CPUTIME_ID)at the start and end of your request.total_timecan be found as the difference ofProcess.clock_gettime(Process::CLOCK_MONOTONIC)at the start and end of your request. ↩︎A small note on other anomalies you might see. If you are running your application on Heroku’s Common Runtime (running Standard-1X or Standard-2X dynos) you might every so often get individual dynos which spike in request duration and queue time, this is usually down to ‘noisy neighbours’ hogging resources as you are running on shared infrastructure, these spikes usually resolve themselves as the noisy neighbour calms down or Heroku automatically shuts them off as part of their automatic abuse detection. If you need to get things running smoother faster, restarting the dyno in question will get it back up running on another physical host. ↩︎
It’s worth noting that you usually wouldn’t be able to run your application at full dyno capacity during normal working hours! You usually need to reserve up to 50% of your pool for pre-booting application to ensure you have a smooth rolling deploy (assuming that you deploy regularly throughout the working day like we do at carwow). You also likely need to reserve some connection for your Sidekiq workers, Heroku Scheduler jobs, and the odd production console here and there. ↩︎ ↩︎
We create a follower database (a read-only database to which writes to the lead instance are replicated to) and a new Heroku application running the same application code. We then route ~50% of all safe requests (GET, HEAD, OPTIONS) to that read-only application. The majority of our requests aren’t writing to the database and we can tolerate a little bit of lag on writes in most circumstances (we can also set a cookie after each write to ensure that a client reads from the lead database after a recent write as well). ↩︎
Using Connection Pooling should allow most applications to run at least double the number of dynos they are currently restricted to as removes the need to reserve connections during the preboot phase of a release. This is assuming that you are using preboot (which you should be, if you are releasing on a regular basis). Any additional horizontal scaling opportunity afforded by Connection Pooling will rely on the current connection utilisation of you application. If you already spend 100% of the time in your requests doing database work, connection pooling is not going to allow you to make better or more efficient use of your connections, they are already being optimally utilised.
If you only spend ~50% then you have the potential opportunity to allow more clients to connect and share the underlying pool to increase the utilisation. The lower your current utilisation to more opportunity Connection Pooling offers your application to scale horizontally passed its current threshold. ↩︎
As alluded to in the footnote on pooling4, during the preboot window of your application you could run up to double the number of dynos in your formation. The outgoing dynos might not stop doing work as soon as the incoming dynos are started, this can lead to brief periods of time where your application requires DB connections that exceeds how many are available leading to potentially large increases in errors during deploys. If you deploy often this can affect reliability significantly. For this reason it is usually wise to limit the maximum number of dynos you scale to in order to accommodate for this. You might also want to avoid having ‘double deploys’ to avoid overlapping preboot windows. You can usually do this by queuing deploys and grouping multiple commits merged within some specified time window together so they are part of the same release and therefore preboot window. ↩︎